
1-Minute Clinical Biomarker Briefing
Fasting Insulin vs HOMA-IR: Optimal Longevity Range & Clinical Calculation
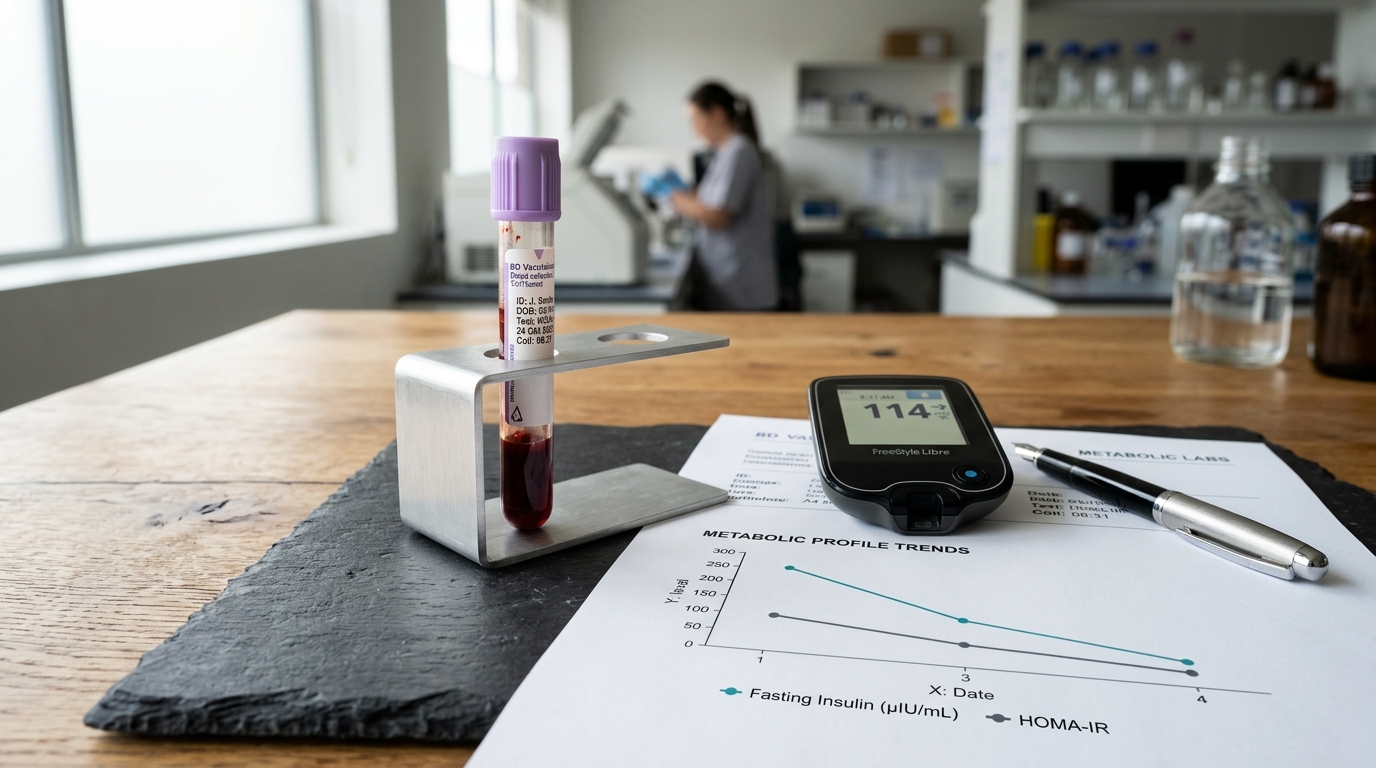
Standard annual physicals rely almost exclusively on fasting blood glucose and HbA1c, creating a dangerous 10-to-15 year diagnostic blind spot. Pancreatic beta cells can hyper-secrete insulin for decades to force glucose into resistant tissues, keeping fasting glucose “normal” while silent vascular and visceral damage escalates. Evaluating fasting insulin vs homa ir optimal longevity range provides the true early-detection gold standard for metabolic health.
While conventional reference ranges permit fasting insulin up to 25 µIU/mL, the clinical longevity target is strictly 2.0 to 5.0 µIU/mL, and an optimal Homeostatic Model Assessment of Insulin Resistance (HOMA-IR) score must remain below 1.0. Scores above 1.5 indicate subclinical resistance, while values exceeding 2.0 signal overt cardiometabolic risk.
For decades, conventional medicine has treated type 2 diabetes and metabolic dysfunction as conditions that appear overnight when fasting glucose crosses 100 mg/dL or HbA1c reaches 5.7%. In clinical reality, hyperinsulinemia precedes glucose elevation by up to fifteen years. Your body will produce massive amounts of insulin to maintain euglycemia until your beta cells eventually exhaust.
Understanding your fasting insulin vs homa ir optimal longevity range is the single most actionable step you can take to assess true biological aging, endothelial elasticity, and visceral fat storage. By measuring both fasting insulin and fasting glucose simultaneously, you can calculate your HOMA-IR score and intervene with targeted nutritional and exercise protocols long before irreversible metabolic damage occurs.
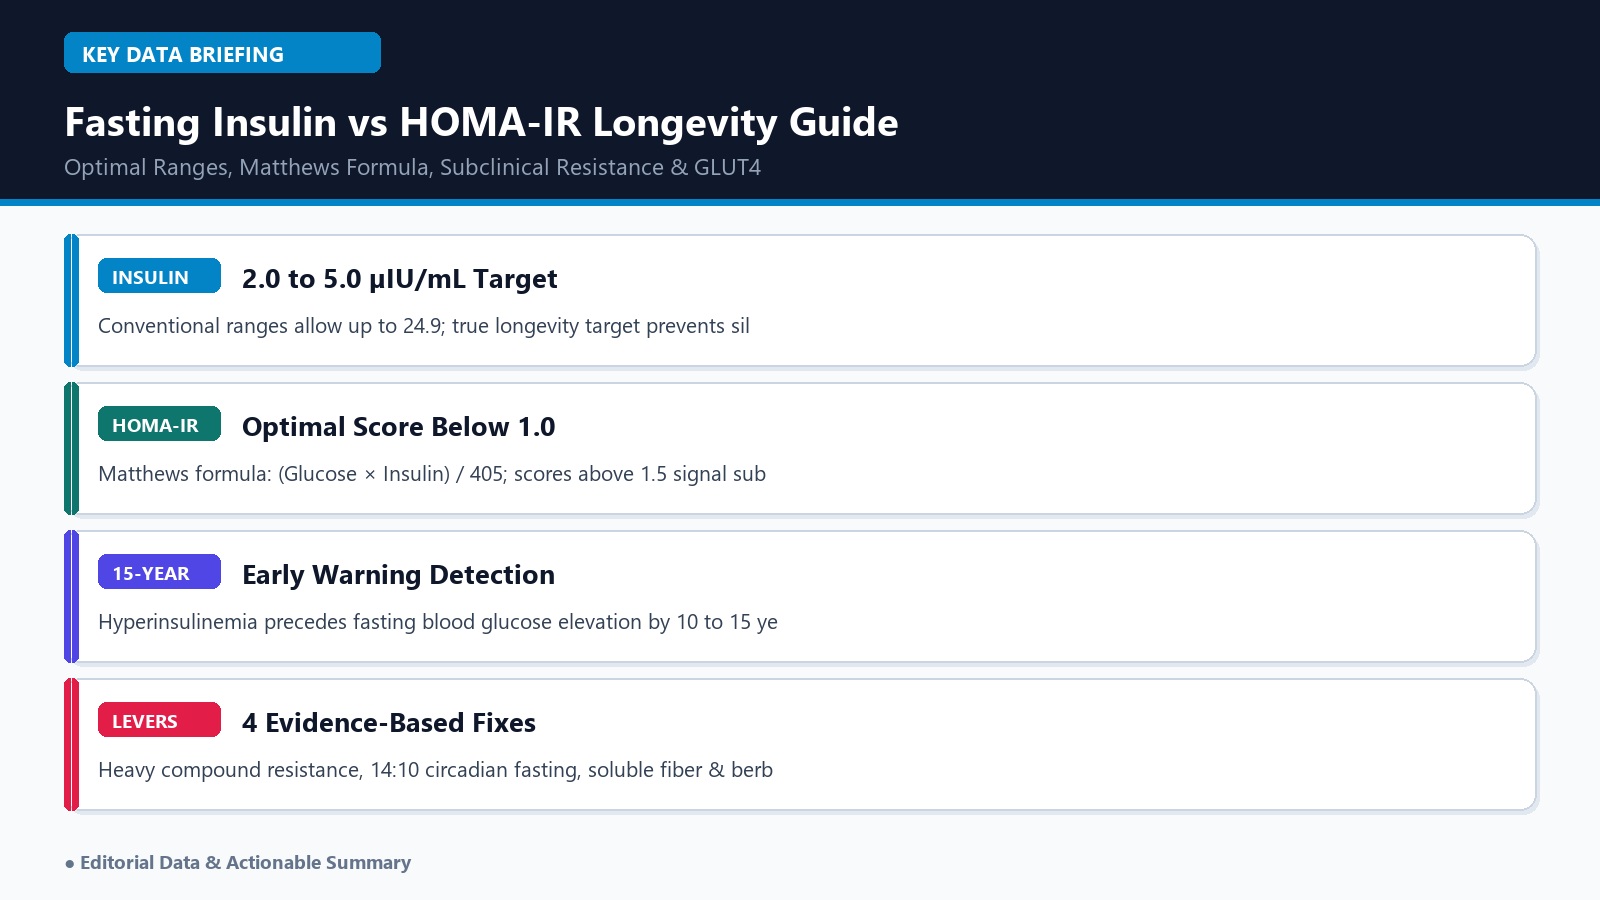
Figure 1: The Metabolic Continuum: Fasting Glucose, Fasting Insulin, HOMA-IR, and 15-Year Disease Progression.
Metabolic Biomarkers: Standard Reference Ranges vs. 2026 Longevity Standards
Conventional laboratory “normal” ranges are derived from the statistical average of a largely sedentary, metabolically compromised population. The comparison matrix below contrasts outdated conventional thresholds with evidence-based longevity targets.
| Biomarker Metric | Conventional “Normal” Range | 2026 Optimal Longevity Target | Pathophysiological Mechanism & Risk |
|---|---|---|---|
| 1. Fasting Insulin | 2.6 to 24.9 µIU/mL | 2.0 to 5.0 µIU/mL (<6.0 µIU/mL maximum) | Values >8.0 trigger lipogenesis, blunt lipolysis (fat burning), and cause renal sodium retention |
| 2. HOMA-IR Score | <2.0 (Often not calculated on standard labs) | <1.0 (Optimal Sensitivity); 1.0–1.4 (Borderline) | Scores >1.5 indicate subclinical liver & muscle resistance; >2.5 indicates severe insulin resistance |
| 3. Fasting Glucose | 70 to 99 mg/dL | 72 to 86 mg/dL | Fasting glucose >90 mg/dL is associated with a progressive increase in 10-year coronary artery disease risk |
| 4. Hemoglobin A1c (HbA1c) | <5.7% (Normal) | 4.8% to 5.2% | Reflects 90-day glycation; can mask major postprandial glucose swings in people with high red blood cell turnover |

Figure 2: Tracking fasting insulin and HOMA-IR reveals metabolic health long before conventional blood sugar abnormalities emerge.
1. The 15-Year Blind Spot: Why Fasting Glucose Alone Is Dangerously Misleading
To appreciate why clinicians must compare fasting insulin vs homa ir optimal longevity range, consider how insulin resistance develops at the cellular level. When skeletal muscle and hepatocytes become overwhelmed by chronic energy surplus, visceral adiposity, or physical inactivity, their insulin receptors downregulate.
In response, the pancreas compensates by secreting higher quantities of insulin. If a healthy person requires 4 µIU/mL of insulin to clear a morning glucose load, an insulin-resistant individual might require 18 to 22 µIU/mL to achieve the exact same clearance.
On a standard annual lab panel, both individuals will display an identical fasting glucose reading of 88 mg/dL and an HbA1c of 5.1%. The doctor declares both patients “metabolically healthy.” Yet the second individual is suffering from severe hyperinsulinemia. Chronic elevation of insulin drives systemic nitric oxide depletion, stiffens arterial walls, elevates ApoB and triglycerides, suppresses hormone-sensitive lipase (making weight loss nearly impossible), and promotes oncogenic cellular proliferation via IGF-1 pathways.
2. HOMA-IR Mathematical Formula & Clinical Stratification
The Homeostatic Model Assessment of Insulin Resistance (HOMA-IR) mathematically models the dynamic feedback loop between hepatic glucose output and pancreatic insulin secretion. It was developed by Matthews et al. in 1985 and validated against the hyperinsulinemic-euglycemic clamp (the gold-standard laboratory technique).
The Standard HOMA-IR Calculation:
HOMA-IR = (Fasting Glucose [mg/dL] × Fasting Insulin [µIU/mL]) / 405
Note: If glucose is measured in mmol/L (standard in Europe and Canada), the formula is: (Fasting Glucose [mmol/L] × Fasting Insulin [µIU/mL]) / 22.5
Clinical Stratification of HOMA-IR Scores:
- <1.0 — Optimal Insulin Sensitivity: Exceptional metabolic efficiency; uncompromised fat oxidation; minimal visceral fat accumulation.
- 1.0 to 1.4 — Early Compensatory Phase: Mild insulin resistance; early dietary and exercise interventions easily restore optimal sensitivity.
- 1.5 to 1.9 — Subclinical Insulin Resistance: Moderate metabolic inflexibility; frequent energy crashes, difficult weight loss, and elevated triglycerides.
- ≥2.0 — Significant Metabolic Dysfunction: Severe hyperinsulinemia; high risk for non-alcoholic fatty liver disease (MASLD), hypertension, and cardiometabolic events.
3. The 4 Evidence-Based Levers to Drive HOMA-IR Below 1.0
If your lab results reveal elevated fasting insulin or a HOMA-IR score above 1.4, pharmaceutical intervention is rarely necessary as a first-line treatment. Implementing the following four mechanical and nutritional levers reliably lowers fasting insulin within 8 to 12 weeks:
1. Heavy Compound Resistance Training (Non-Insulin GLUT4 Translocation)
Skeletal muscle accounts for over 80% of total postprandial glucose disposal. When you perform heavy resistance exercises (working at RPE 7–8 on squats, rows, and deadlifts), muscular contraction triggers AMPK and mechanically moves GLUT4 glucose transporters to the cell membrane without requiring insulin. This rapidly depletes intramuscular glycogen and resensitizes insulin receptors.
2. 14:10 Circadian Fasting & Evening Carb Curfew
Human insulin sensitivity follows a strict circadian rhythm, peaking in the morning and declining precipitously after sunset. Eating heavy carbohydrate meals late in the evening forces beta cells to pump out prolonged nighttime insulin. Instituting a 14-hour overnight fast and completing all starchy carbohydrates by 6:00 PM drops baseline nocturnal insulin to the optimal 2–4 µIU/mL range.
3. Viscous Soluble Fiber & Acetic Acid (Vinegar Protocol)
Consuming 10g to 15g of viscous soluble fiber (psyllium husk, acacia, or chia seeds) or 1 tablespoon of apple cider vinegar in water before starchy meals delays gastric emptying and inhibits alpha-amylase, reducing postprandial glucose surges by up to 34% and cutting post-meal insulin demand in half.
4. Targeted AMPK Activators (Berberine & Alpha-Lipoic Acid)
Berberine hydrochloride (500mg twice daily with meals) operates through identical molecular pathways as metformin, stimulating cellular AMPK, suppressing hepatic gluconeogenesis, and upregulating insulin receptor substrate 1 (IRS-1) phosphorylation in muscle cells.
Daily Insulin Sensitivity Optimization: The 24-Hour Protocol
07:30 AM — Hydration & Morning Walk: 16 oz water with electrolytes; 15-minute outdoor sunlight walk. Light physical activity upon waking clears hepatic glycogen stores.
09:00 AM — Protein-First Breakfast: Break your fast with at least 35g of protein (eggs, salmon, or whey isolate) and healthy fats. Avoid naked carbohydrates that trigger rapid insulin spikes.
01:00 PM — Post-Lunch Movement: Take a 10-minute brisk walk immediately following lunch.
09:00 AM — Protein-First Breakfast: Break your fast with at least 35g of protein (eggs, salmon, or whey isolate) and healthy fats. Avoid naked carbohydrates that trigger rapid insulin spikes.
01:00 PM — Post-Lunch Movement: Take a 10-minute brisk walk immediately following lunch.
Postprandial muscle contraction shuttles glucose directly into cells, blunting insulin demand by 25%.
05:30 PM — Resistance Training: 40 minutes of progressive compound strength training (3 to 4 days weekly) to maximize GLUT4 receptor density.
07:00 PM — Dinner & Kitchen Close: High-fiber vegetables, lean protein, and clean complex carbohydrates (sweet potato, quinoa). Close the kitchen strictly 3 hours before sleep.
10:30 PM — Restorative Sleep: Cool bedroom (66°F) and 7.5 to 8.5 hours of uninterrupted sleep. A single night of partial sleep deprivation reduces insulin sensitivity by 25% the next day.
05:30 PM — Resistance Training: 40 minutes of progressive compound strength training (3 to 4 days weekly) to maximize GLUT4 receptor density.
07:00 PM — Dinner & Kitchen Close: High-fiber vegetables, lean protein, and clean complex carbohydrates (sweet potato, quinoa). Close the kitchen strictly 3 hours before sleep.
10:30 PM — Restorative Sleep: Cool bedroom (66°F) and 7.5 to 8.5 hours of uninterrupted sleep. A single night of partial sleep deprivation reduces insulin sensitivity by 25% the next day.
Frequently Asked Questions: Fasting Insulin and HOMA-IR
Q1: How should I prepare for a fasting insulin and glucose blood draw?
Fast strictly for 10 to 12 hours prior to the morning blood draw (water and black coffee only). Avoid strenuous high-intensity exercise, alcohol, and acute psychological stress for 24 hours beforehand, as cortisol and catecholamines can transiently elevate hepatic glucose release and insulin levels.
Q2: Can fasting insulin be too low? What does a reading below 2.0 µIU/mL mean?
In an athletic, low-carbohydrate individual with normal fasting glucose (75–85 mg/dL), a fasting insulin level of 1.5 to 2.5 µIU/mL simply indicates pristine insulin sensitivity. However, if fasting insulin is below 2.0 while fasting glucose is elevated (>100 mg/dL), it can indicate impaired pancreatic beta-cell production (such as Late-Onset Autoimmune Diabetes in Adults, LADA). Always evaluate insulin in conjunction with glucose and C-peptide.
Q3: How often should I re-test my fasting insulin and HOMA-IR?
If your initial HOMA-IR score is elevated (>1.4), re-testing every 12 weeks provides adequate time to measure the objective physiological impact of dietary changes, strength training, and lifestyle interventions. Once you maintain an optimal score (<1.0), annual monitoring is sufficient.
Q4: Why don’t standard doctors order fasting insulin during annual physicals?
Traditional medical guidelines are structured around disease management rather than proactive health optimization. Because standard diabetes diagnostic codes (ICD-10) are defined strictly by glucose and HbA1c thresholds, insurance reimbursement often excludes routine fasting insulin testing unless metabolic syndrome or diabetes is already diagnosed. However, patients can easily request fasting insulin as an affordable out-of-pocket add-on ($15–$25 at Labcorp or Quest Diagnostics).
Related Clinical Protocols & Evidence Guides
Medical Disclaimer: This article is for educational and informational purposes only and does not substitute for clinical medical advice, formal diagnosis, or individualized treatment plans. Always consult with your board-certified endocrinologist, internal medicine physician, or licensed healthcare provider before making major changes to your medication regimen, dietary habits, or supplement protocols.